

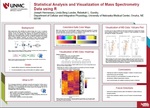
Statistical analysis and visualization of mass spectrometry data using R
Files
Download Joseph Hennessey Original Presentation File (993 KB)
Publication Date
Summer 8-6-2020
College, Institute, or Department
MD/PhD Scholars Program
Faculty Mentor
Rebekah L. Gundry
Research Mentor
Linda Luecke
Document Type
Poster
Abstract
Mass spectrometry (MS) identifies the mass-to-charge ratio of ions. In proteomic research, MS can be used to identify proteins in a sample by digesting proteins into peptides, ionizing the peptides, then detecting the peptides and fragments of peptides via a mass spectrometer. However, most proteomic experiments identify large numbers of proteins and at times it can be difficult to efficiency communicate results of large datasets. Therefore, we sought to apply various visualization techniques in R to allow for fast and effective processing of large MS datasets.
Keywords
Mass spectrometry, visualization, proteomics
Recommended Citation
Hennessey, Joseph; Berg Luecke, Linda; and Gundry, Rebekah, "Statistical analysis and visualization of mass spectrometry data using R" (2020). Posters: 2020 Summer Undergraduate Research Program. 14.
https://digitalcommons.unmc.edu/surp2020/14